
Share this page
Celebrating the College’s 20th Anniversary.
By Steve Brearton
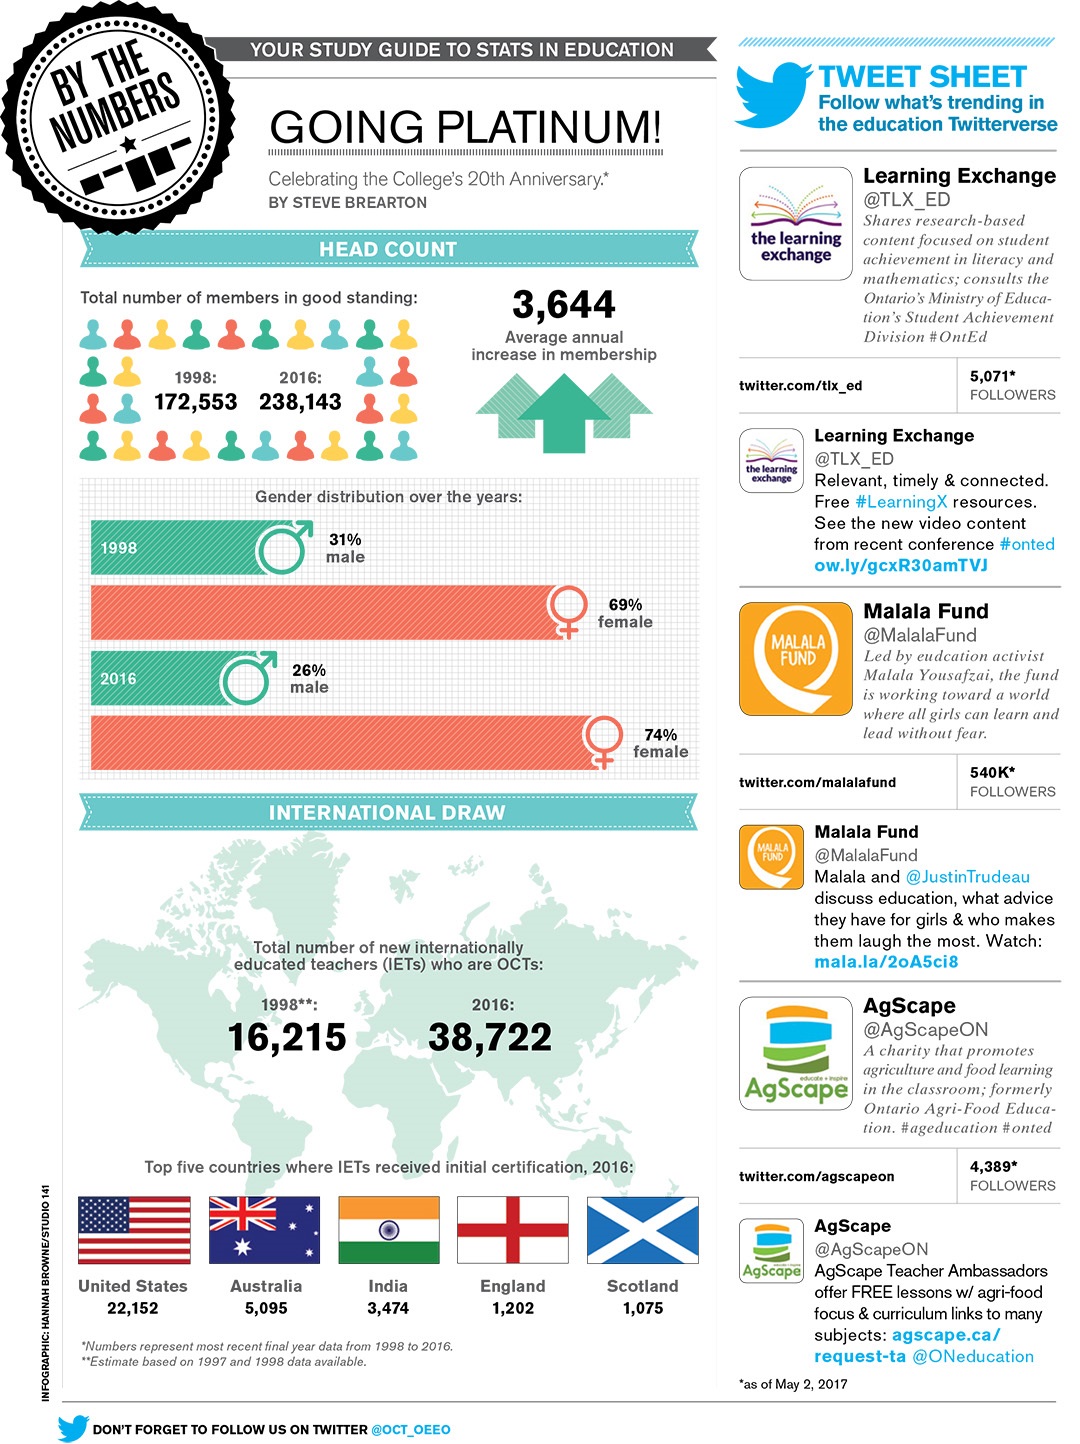
An illustrated infographic titled By The Numbers: Going Platinum, celebrating the College’s 20th Anniversary by Steve Brearton. The infographic is divided into two sections.
The first section is called Head Count and lists the following information: in 1998 there were 172,553 members of the Ontario College of Teachers in good standing and in 2016 there were 238,143. The average annual increase in membership is 3,644. The gender distribution of membership is as follows: in 1998 31% were male and 69% were female. In 2016 26% were male and 74% were female.
The next section is titled, International Draw and lists the following data: In 1998 the total number of new internationally educated teachers who were Ontario Certified Teachers was 16,215. In 2016 this number increased to 38,722. The top five countries of origin for internationally educated teachers who were Ontario Certified Teachers in 2016: United Stated, 22,152. Australia, 5,095. India, 3,474. England, 1,202. Scotland, 1,075.