Share this page
Examining Special Education in Ontario.
By Steve Brearton

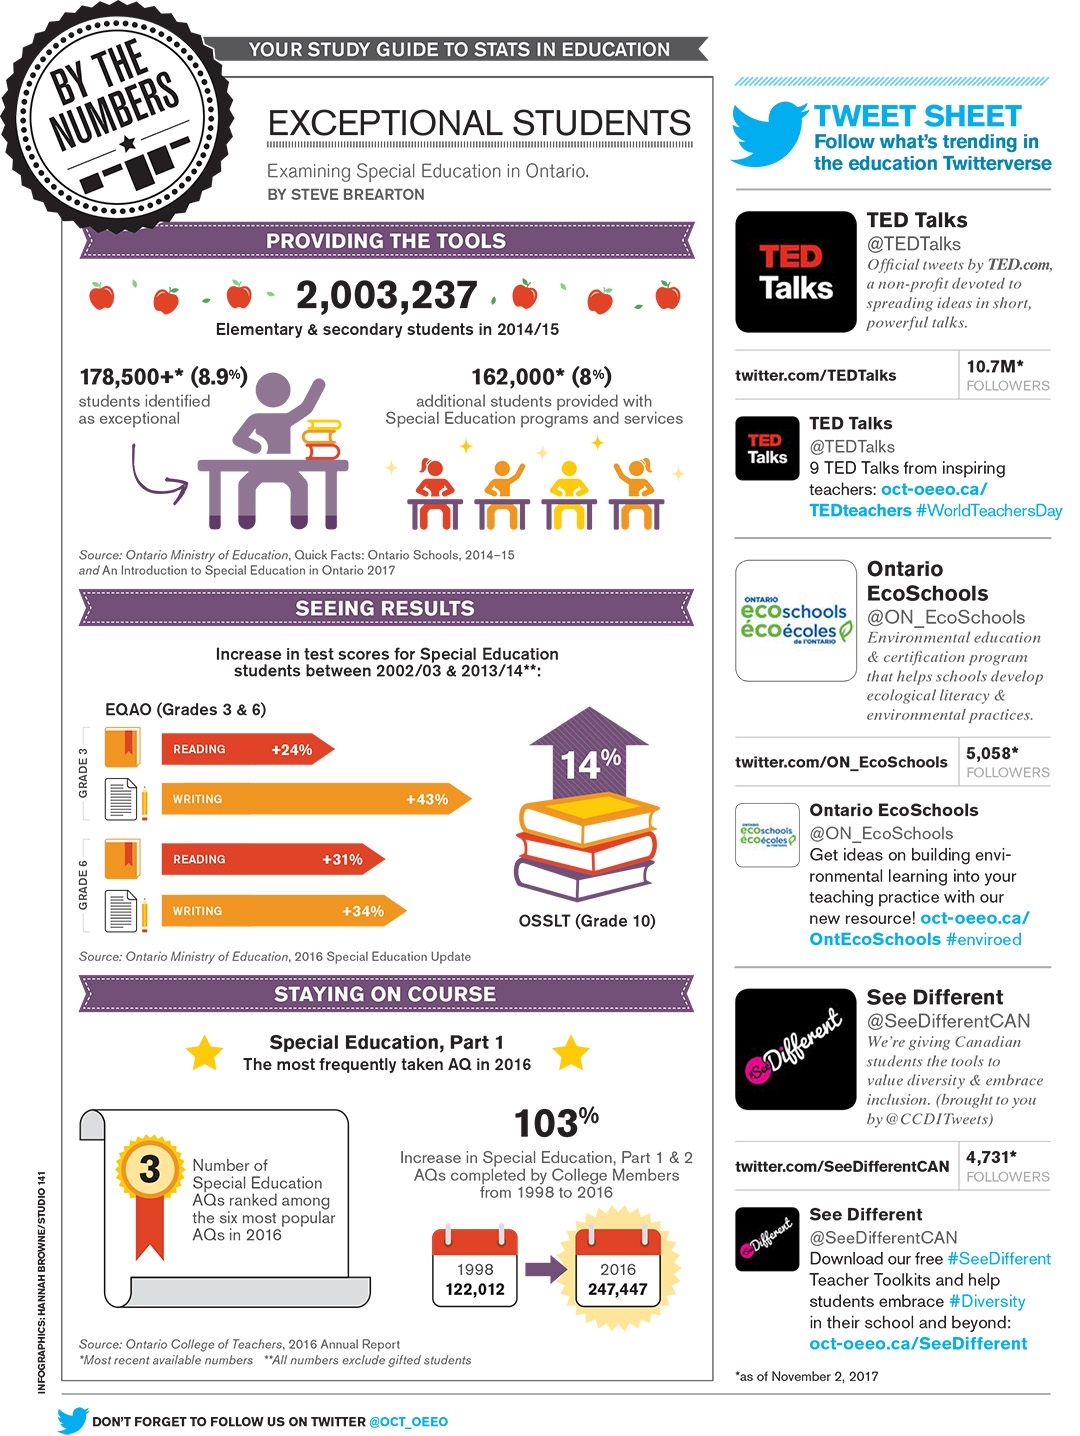
An illustrated infographic titled, By The Numbers: Exceptional students, examining special education in Ontario by Steve Brearton. The infographic is divided into three sections.
The first section is titled Providing the Tools and presents the following data: From 2014 to 2015 there were 2,003,237 elementary and secondary students. Over 178,500 (or 8.9%) were identified as exceptional and 162,000 (or 8%) were provided with Special Education programs and services. The source of this data is the Ontario Ministry of Education's Quick Facts for Ontario Schools, 2014–15 as well as An Introduction to Special Education in Ontario 2017".
The next section is titled Seeing Results and illustrates an increase in test scores for Special Education students between 2002 to 2003 and 2003 to 2014. For Grade 3 EQAO reading increased 24% and writing increased 43%. For Grade 6 EQAO reading increased 31% and writing increased 34%. For grade 10 OSSLT increased 14%. The source of this data is the Ontario Ministry of Education's 2016 Special Education Update".
The next section is titled Staying on Course and says: "Special Education, Part 1 was the most frequently taken Additional Qualification in 2016. In 2016, three of the top six Additional Qualification courses were related to Special Education. From 1998 to 2016 there was an increase of 103% in the number of College members who completed Special Education Additional Qualification part 1 and 2". The source of this data is the Ontario College of Teachers 2016 Annual Report.