
Share this page
The results are in from Professionally Speaking's 2013 reader survey.
By Steve Brearton
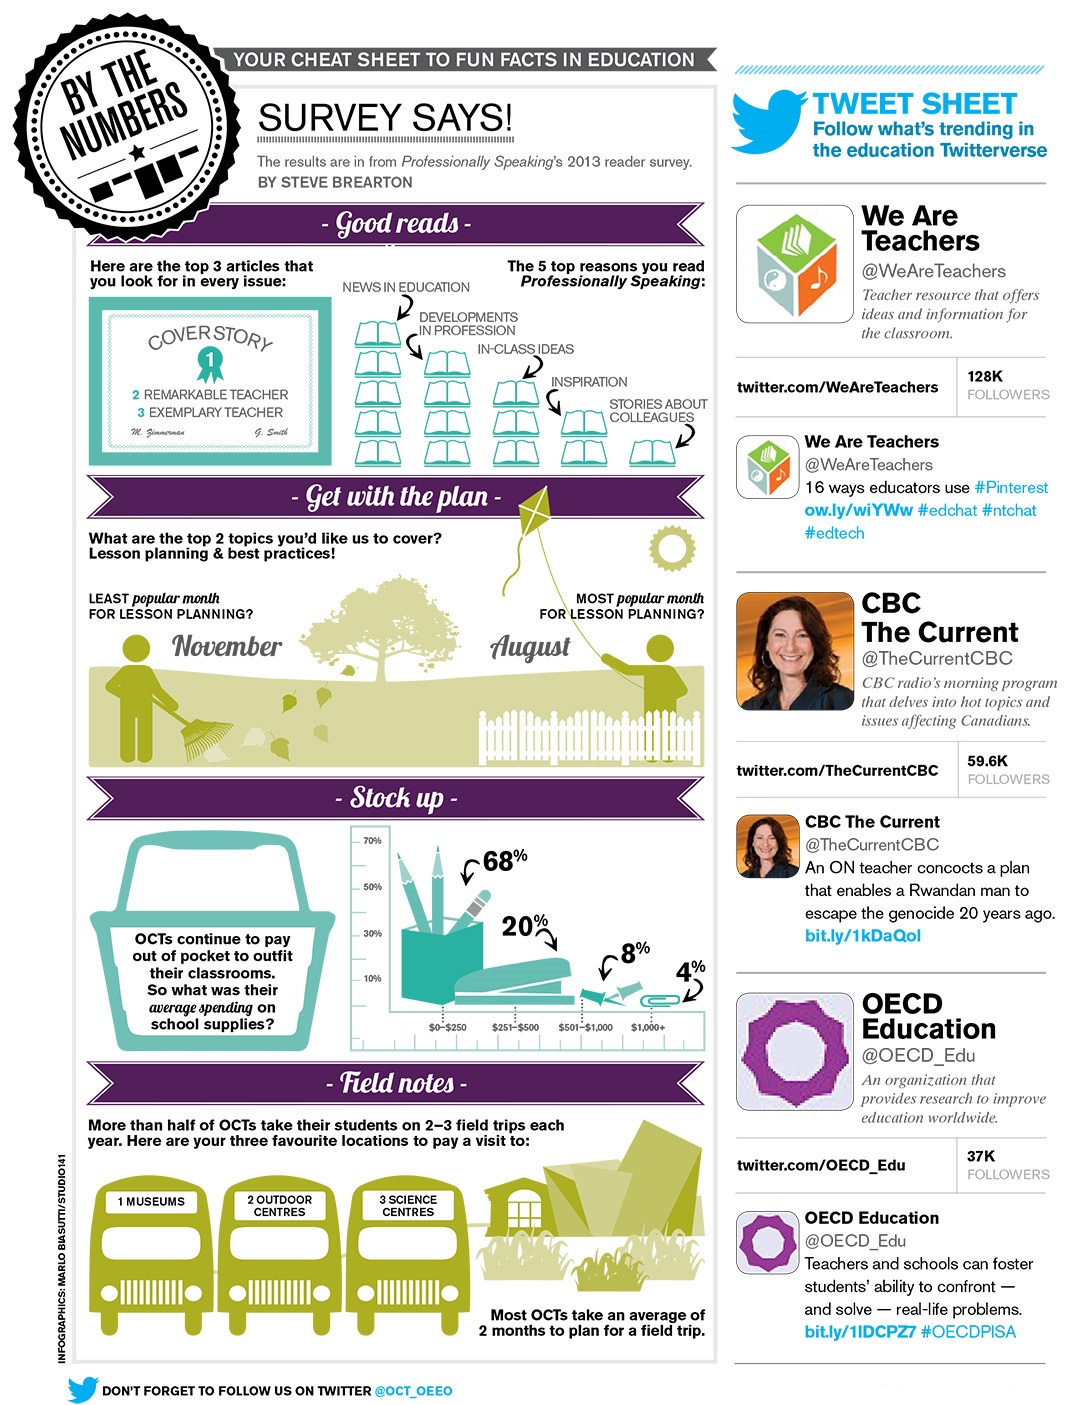
An illustrated infographic titled By The Numbers: Survey Says! The results are in from Professionally Speaking's 2013 reader survey by Steve Brearton.The infographic is divided into four sections.
The first section is called Good Reads and says the following, "The three articles that you look for in every issue of Professionally Speaking are the cover story, Remarkable Teacher and Exemplary Teacher. The five most common reasons you read Professionally Speaking are for news in education, developments in the profession, in-class ideas, inspiration and stories about colleagues.
The next section is titled, Get With The Plan and says, "The two topics you'd like us to cover are lesson planning and best practices. The least popular month for lesson planning is November and the most popular month for lesson planning is August."
The next section is titled Stock Up and says, "Ontario Certified Teachers continue to pay out of pocket to outfit their classrooms. So what was the average spending on school supplies?" The following data is presented: 68% spent $0 to $250 on school supplies. 20% spent $251 to $500. 8% spent $501 to $1,000. 4% spent $1,000 and greater.
The next section is titled Field Notes and says, "More than half of all Ontario Certified Teachers take their students on two to three field trips each year. Here are your three favourite locations to pay a visit to: one, museums. two, outdoor centres. three, science centres."