Share this page 

Facts and Figures

By Melissa Campeau
Photos: Matthew Plexman, Danforth Collegiate and Technical Institute

Photo of four people. Two are students looking, each looking through a microscope with a person standing to the right of them.
MOST FREQUENTLY TAKEN AQ COURSES IN 2018*
1
Special Education, Part I
3,383
2
Mathematics, Primary and Junior, Part I
2,274
3
Teaching English Language Learners, Part I
1,700
4
Special Education, Part II
1,389
5
Kindergarten, Part I
1,272
6
Religious Education in Catholic Schools, Part I
1,096
7
Special Education, Specialist
1,070
8
Guidance and Career Education, Part I
968
9
Mathematics, Primary and Junior, Part II
894
10
Principal's Qualifications, Part I
823

THE MAIN AQ COURSES/PROGRAMS REFERENCED IN AQ INQUIRIES**

FIND AN AQ SEARCH TOOL STATS (OCT.CA)***

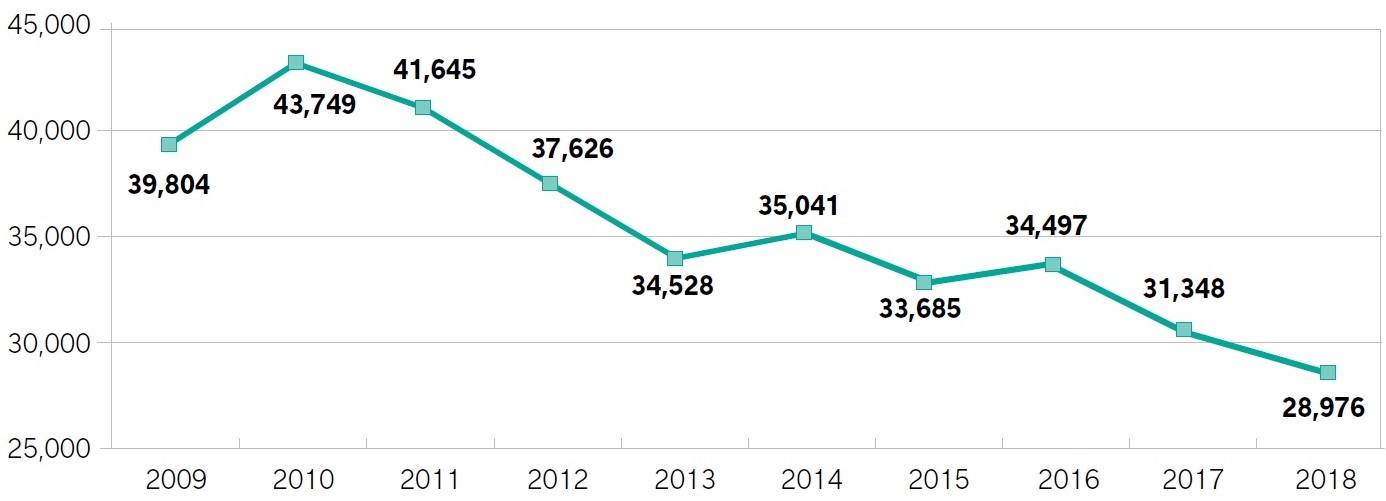
Number of Inquires on Find an AQ:


NATURE OF THE INQUIRIES**

TOTAL NUMBER OF AQs AWARDED ANNUALLY*
Line graph showing data for the total number of AQs awarded in 2018: 39,804 in 2009, 43,749 in 2010, 41,645 in 2011, 37,626 in 2012, 34,528 in 2013, 35,041 in 2014, 33,685 in 2015, 34,497 in 2016, 31,348 in 2017 and 28,976 in 2018.

MEMBERS WITH PRINCIPAL QUALIFICATIONS (BY GENDER AS OF JANUARY 2019)*
Bar graph showing data for the members with principal qualifications by gender as of January 2019. In 2009: slightly over 10,000 females, over 5,000 males and over 15,000 total. In 2010: slightly over 10,000 females, over 5,000 males and over 15,000 in total. In 2011, slightly over 10,000 females, over 5,000 males and over 15,000 total. In 2012: approximately 10,000 females, over 5,000 males and over 15,000 total. In 2013: slightly under 10,000 females, over 5,000 males and over 15,000 total. In 2014: under 10,000 females, over 5,000 males and slightly over 15,000 total. In 2015: under 10,000 females, slightly over 5,000 males and slightly under 15,000 total. In 2016: under 10,000 females, slightly over 5,000 males and under 15,000 total. In 2017: under 10,000 females, slightly over 5,000 males and under 15,000 total. In 2018: over 10,000 females, over 5,000 males and approximately 20,000 total.

MEMBERS WITH SUPERVISORY OFFICER'S QUALIFICATIONS (BY GENDER)*
Bar graph showing data for the members with supervisory officer's qualifications by gender. In 2009: over 500 females, over 500 males and over 1500 total. In 2010: over 500 females, over 500 males and over 1500 total. In 2011: over 500 females, over 500 males and over 1500 total. In 2012: over 500 females, over 500 males and over 1500 total. In 2013: over 500 females, over 500 males and over 1500 total. In 2014: over 500 females, over 500 males and over 1500 total. In 2015: over 500 females, over 500 males and over 1500 total. In 2016: over 500 females, over 500 males and over 1500 total. In 2017: over 500 females, over 500 males and over 1500 total. In 2018: over 1500 females, over 2500 males and over 4500 total.

* Source: Ontario College of Teachers, Business Intelligence Data Report

** Source: Ontario College of Teachers, AQ Infographics September 2018 Report

*** Source: Ontario College of Teachers, Find an AQ Data Report