Teaching Students with Communication Needs (Autism Spectrum Disorder)
Guidance and Career Education, Part 1
Kindergarten, Part 1
THE MAIN AQ COURSES/PROGRAMS REFERENCED IN AQ INQUIRIES
Technological Education
American Sign Language
Guidance and Career Education
History
Teaching Students with Communication Needs (Autism Spectrum Disorder)
FIND AN AQ SEARCH TOOL STATS (OCT.CA)
Number of Inquiries on Find an AQ: 154
136 English
18 French
Most referenced course delivery method was online
NATURE OF THE INQUIRIES
General information about a specific course
Providing feedback about courses
Online and/or face-to-face availability of a course
When and where to take a specific course
Recommending a course to a specific provider
Qualification requirements
Course registration process
Recommending a course be offered in French
Course equivalency
TOTAL NUMBER OF AQS AWARDED ANNUALLY*
The section is titled Total Number of AQs Awarded Annually and has a line graph showing the total number of AQ awarded annually between 2010 and 2020.
2010 — 43,749
2011 — 41,645
2012 — 37,626
2013 — 34,528
2014 — 35,041
2015 — 33,685
2016 — 34,497
2017 — 31,348
2018 — 28,976
2019 — 28,218
2020 — 27,333
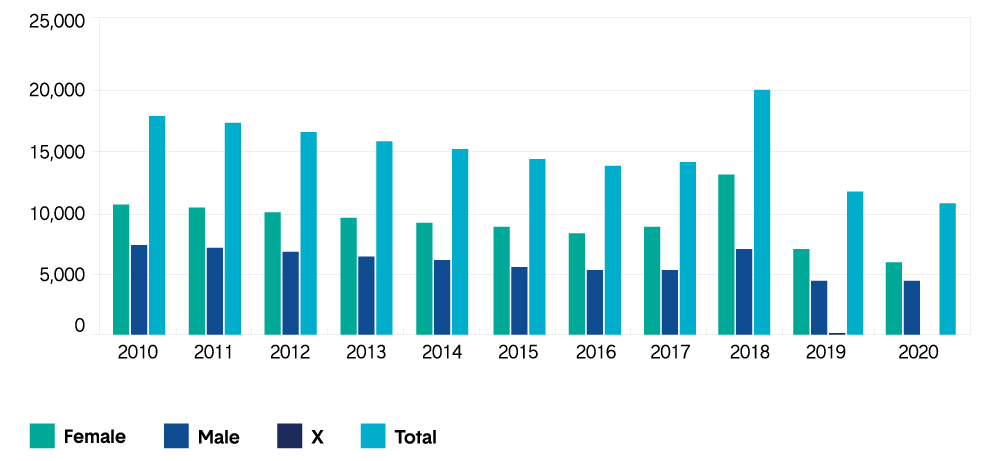
MEMBERS WITH PRINCIPAL QUALIFICATIONS (BY GENDER)*
The section is titled Members with Principal Qualifications (By Gender)* and has a bar graph showing the approximate total number of members with principal qualifications (by gender) between 2010 and 2020.
2010
Female — over 10,000
Male — roughly 5,500
x — 0
Total — roughly 15,500
2010
Female — over 10,000
Male — roughly 5,500
x — 0
Total — roughly 15,500
2011
Female — over 10,000
Male — roughly 5,500
x — 0
Total — roughly 15,500
2012
Female — roughly 10,000
Male — roughly 5,500
x — 0
Total — over 15,000
2013
Female — under 10,000
Male — roughly 5,500
x — 0
Total — over 15,000
2014
Female — under 10,000
Male — roughly 5,500
x — 0
Total — roughly 15,000
2015
Female — under 10,000
Male — over 5,500
x — 0
Total — under 15,000
2016
Female — under 10,000
Male — over 5,000
x — 0
Total — under 15,000
2017
Female — under 10,000
Male — over 5,000
x — 0
Total — under 15,000
2018
Female — roughly 10,500
Male — roughly 5,500
x — 0
Total — roughly 20,000
2019
Female — roughly 5,500
Male — under 5,000
x — More than 0
Total — Over 10,000
2020
Female — More than 5,000
Male — Less than 5,000
x — More than 0
Total — More than 10,000
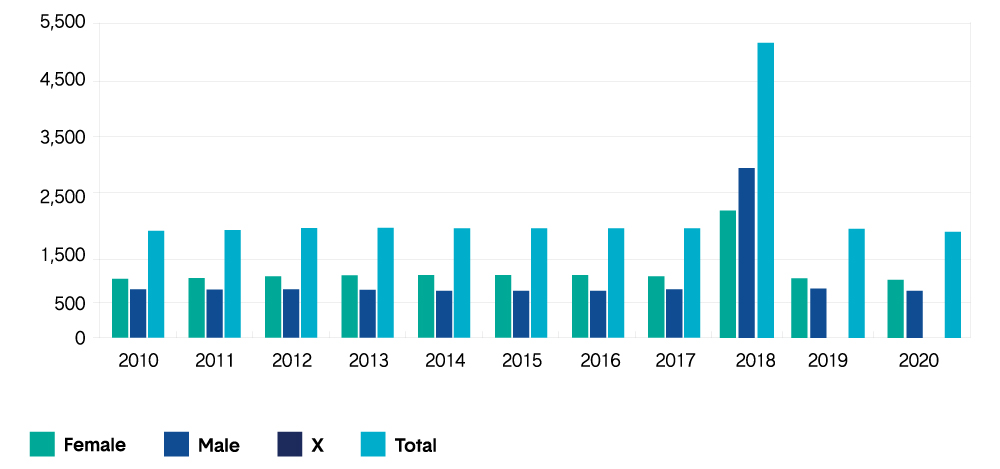
MEMBERS WITH SUPERVISORY OFFICER'S QUALIFICATIONS (BY GENDER)*
"The section is titled Members with Supervisory Officer's Qualifications Qualifications (By Gender)* and has a bar graph showing the approximate total number of members with principal Supervisory Officer's qualifications (by gender) between 2010 and 2020.